
Herd: Direction · Breaking down the silos
Now you know where you’re going.
Sales, Marketing, Service and Ops on one chart, one set of tensions, one action plan.
Built into Herd: Work. Yearly Objectives and People Goals, Closed Won and pipeline, well-rated client cases, campaigns and Ops work, measured together and against real market peers.
From your dashboard to one plan.
Dana Reyes, CEO of our demo company Harbor Point Partners, starts on her own dashboard and opens the CEO view. All four areas land on one chart, then break out into one shared tension and one ranked action plan, measured against real peers.
Recorded live in Herd: Work using the Harbor Point Partners demo company. Captions available.
Eleven screens. One direction.
Scroll at your own pace. Each step is a real screen from Herd: Direction.
-
1
Every leader starts on their own dashboard
The Direction widget matches each leader's role. The CEO sees Yearly Objectives on track and high tensions, the CRO sees Closed Won and pipeline, and the COO sees Ops readiness and well-rated cases. It's one company picture, read through each role.
CEOCROCOO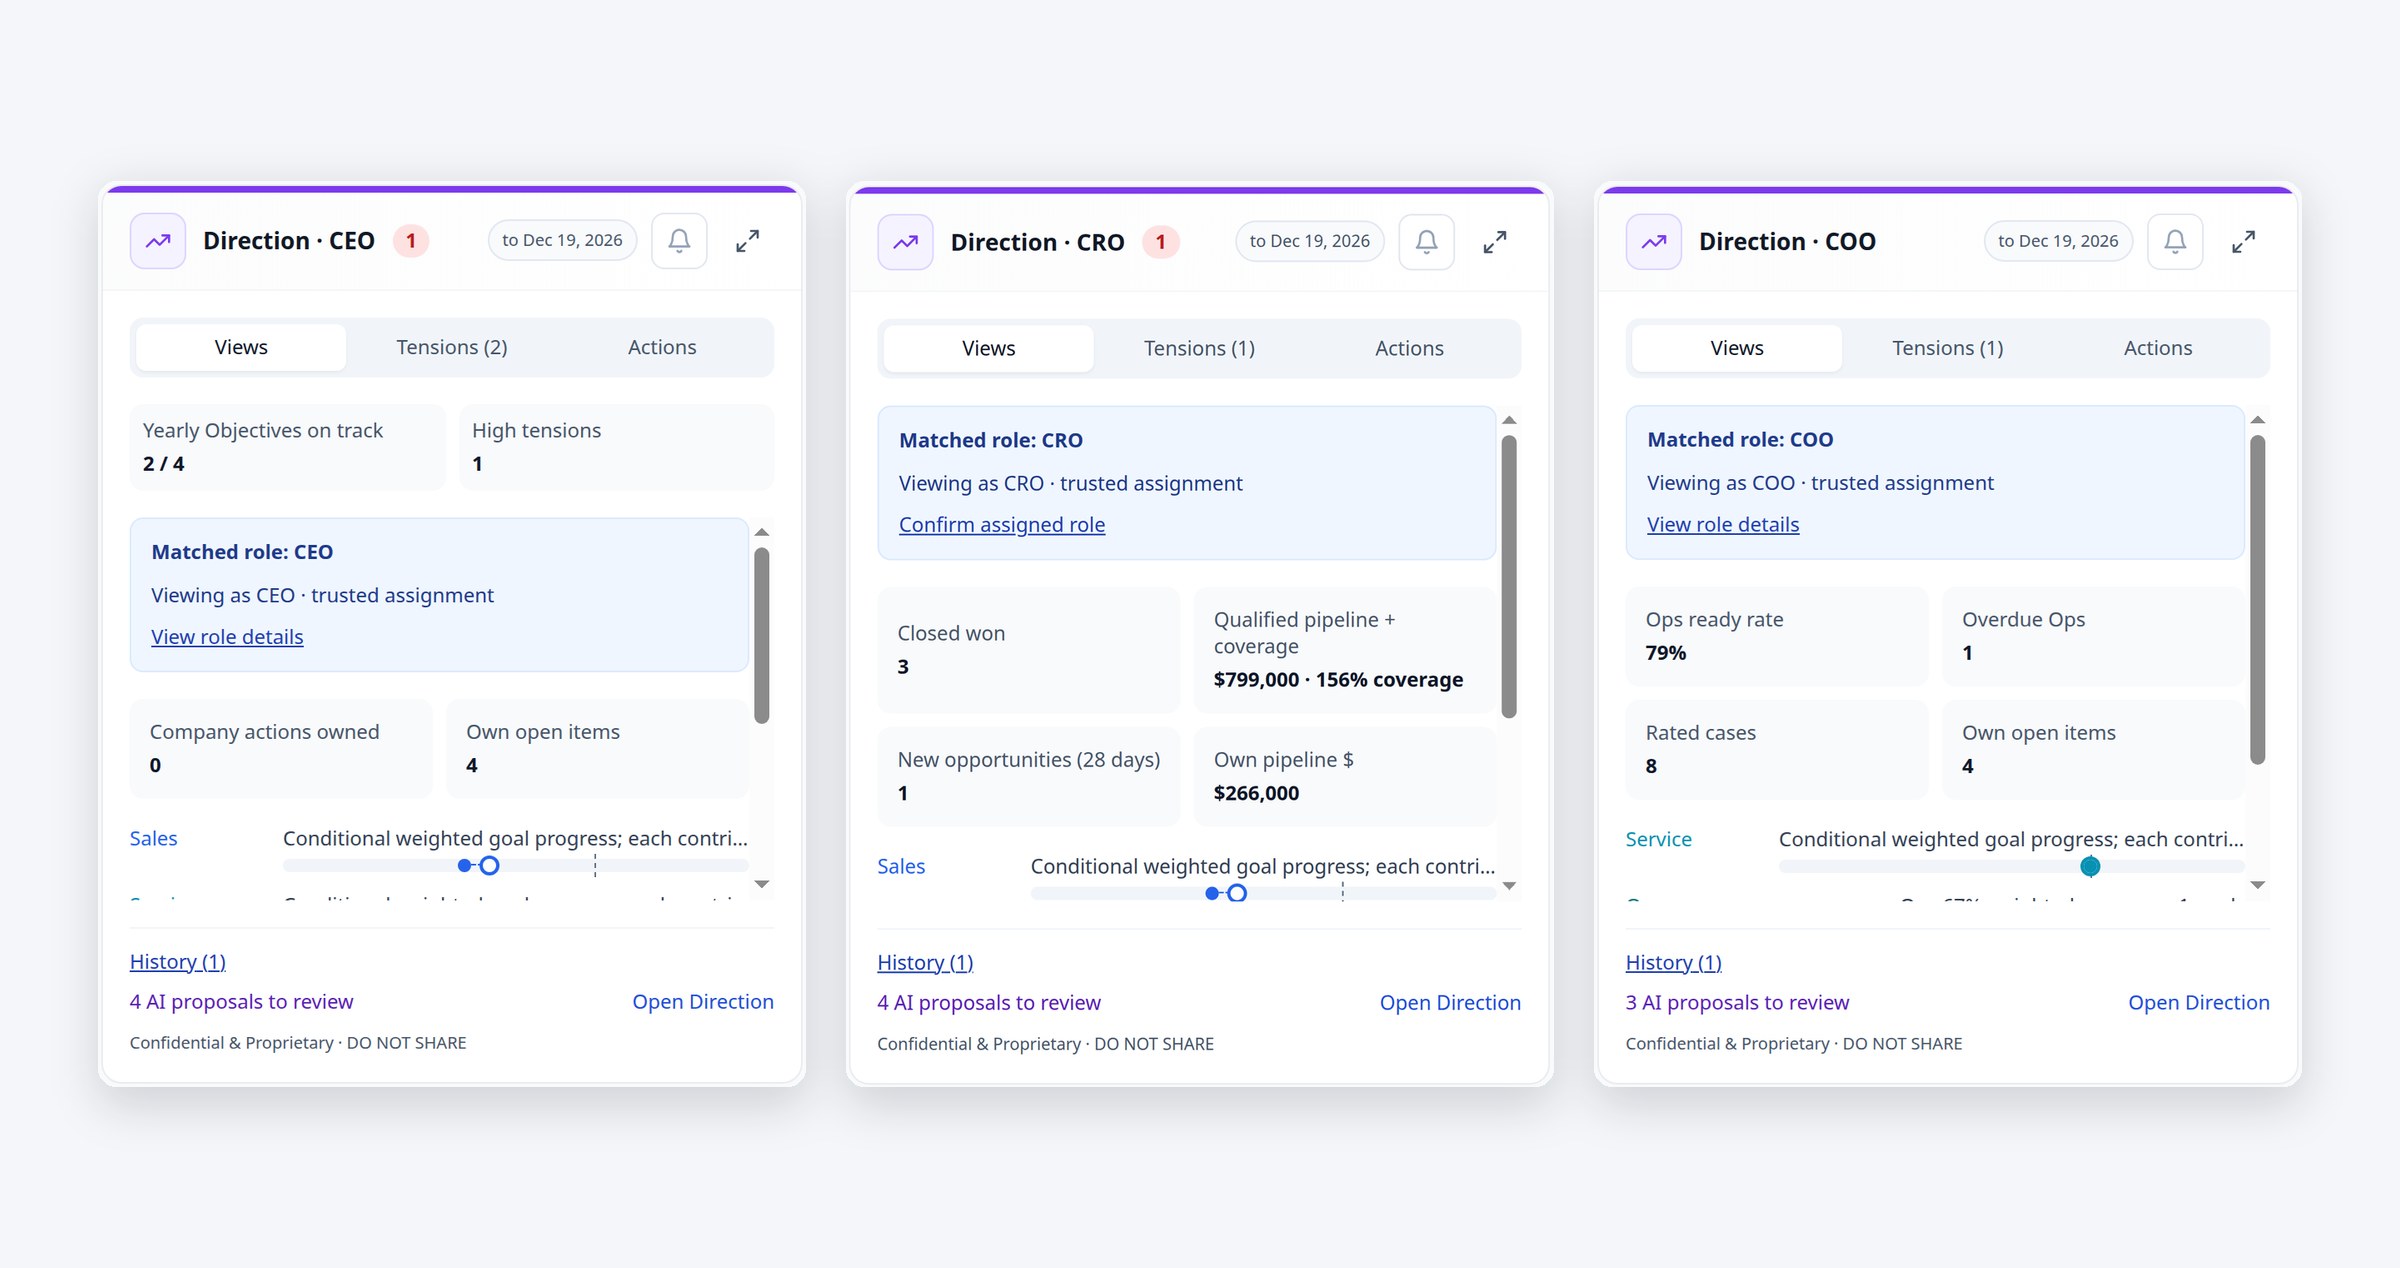
-
2
CEO view
Company Admin opens the CEO view of the Direction report: where the business stands this year, with Yearly Objectives and People Goals behind every number.
Yearly ObjectivesPeople Goals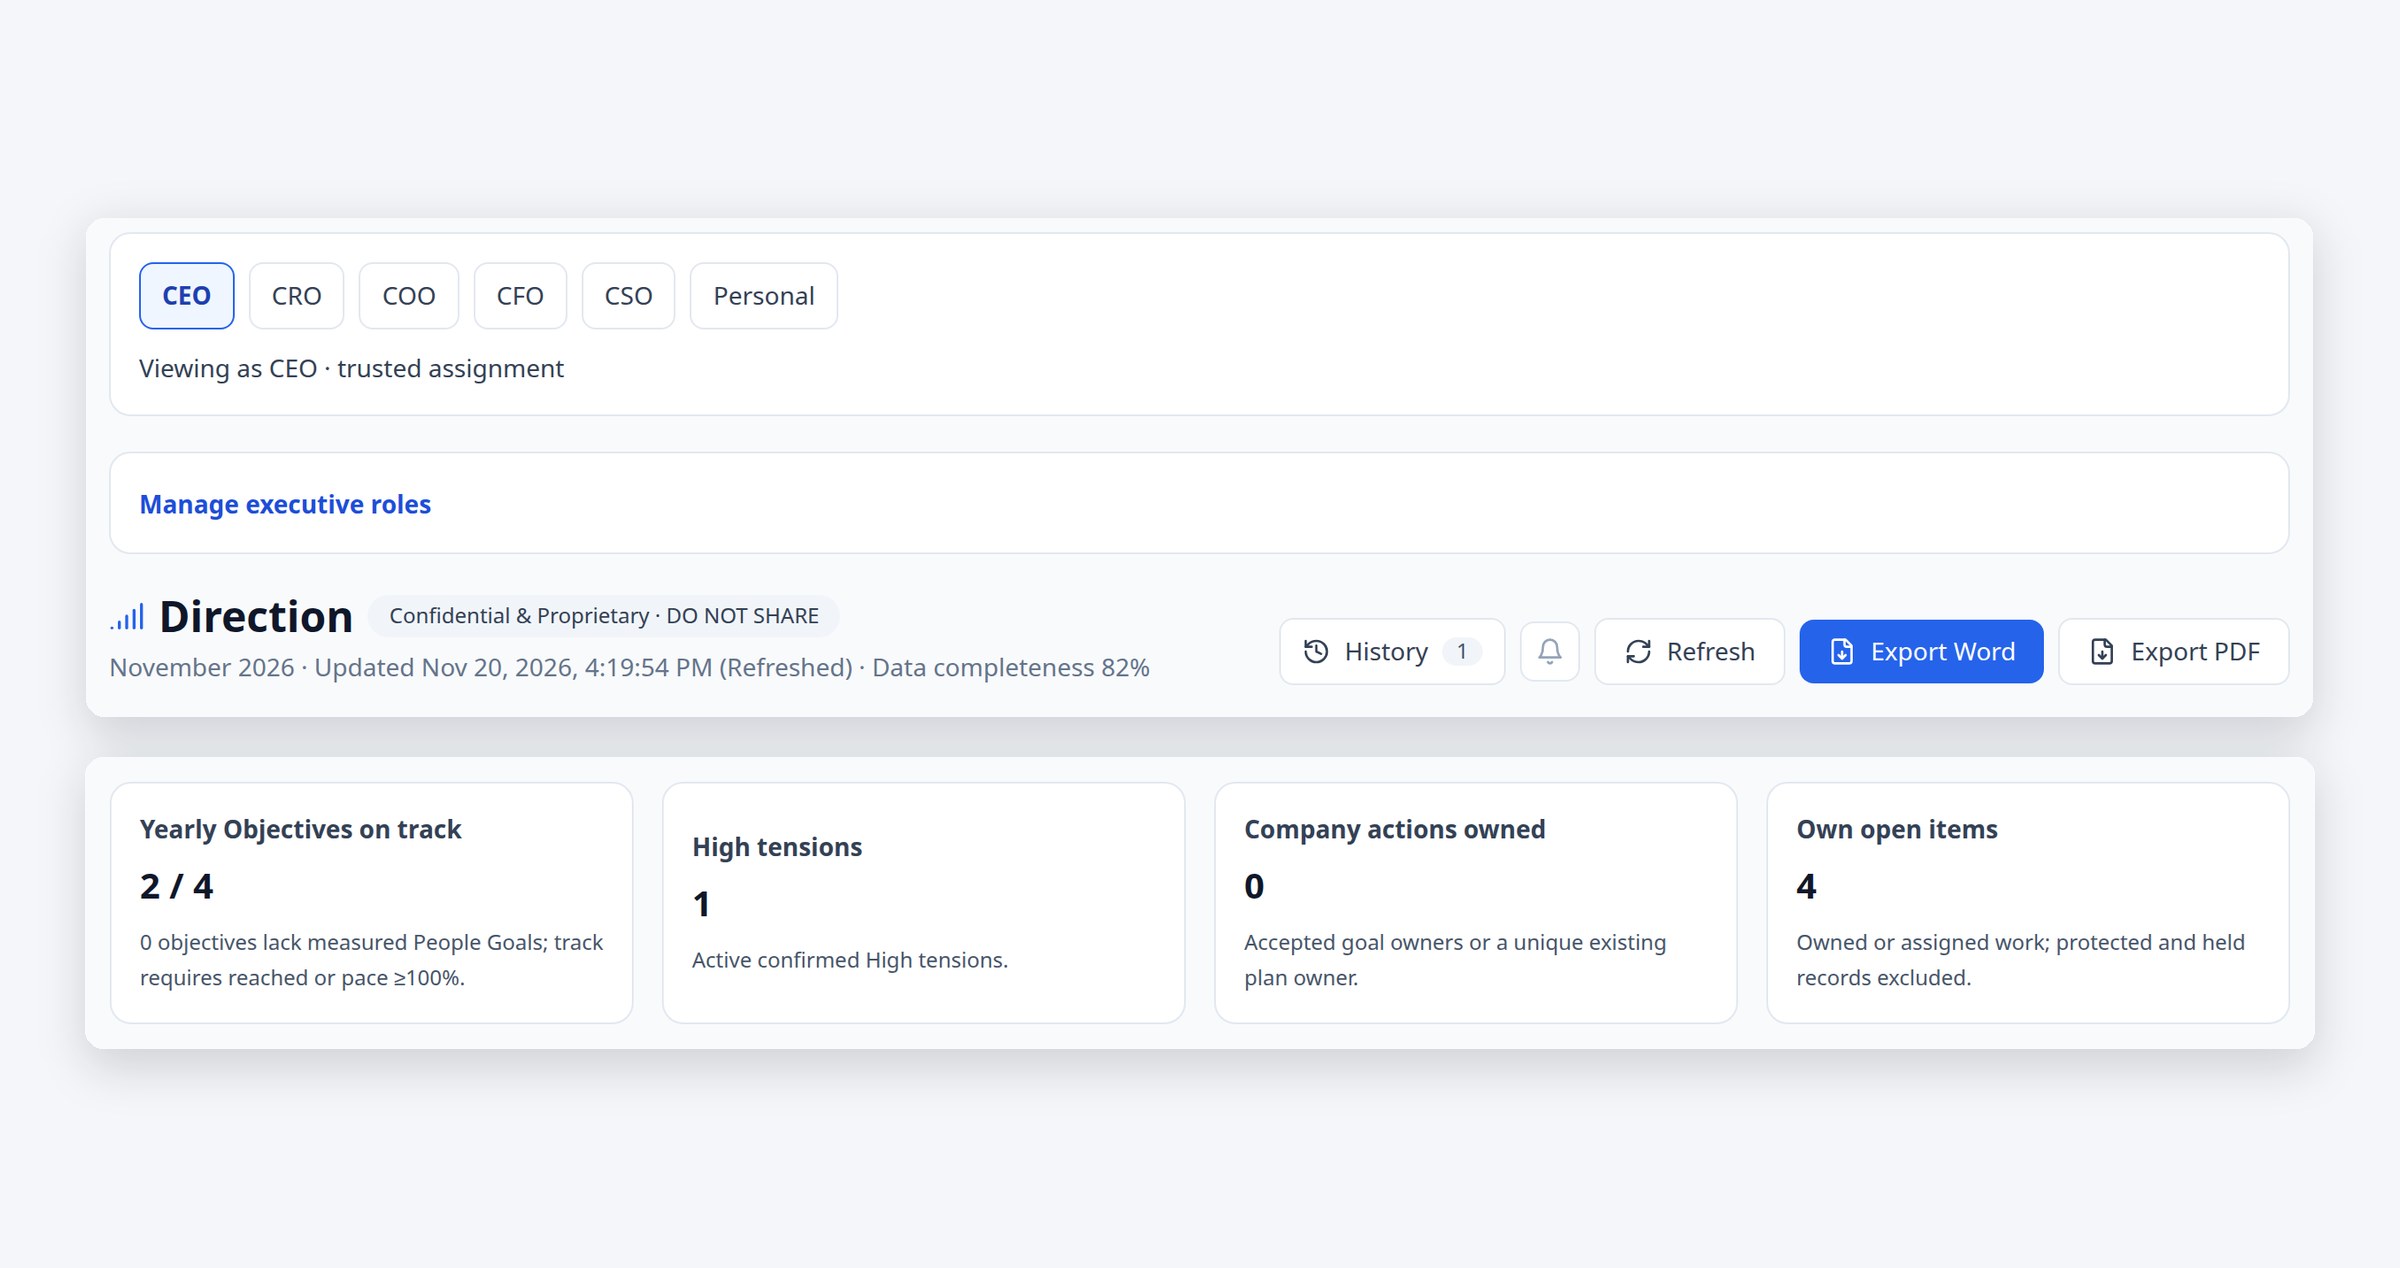
-
3
One chart
Sales, Marketing, Service and Ops on one chart, each measured against its own target, window by window.
SalesMarketingServiceOps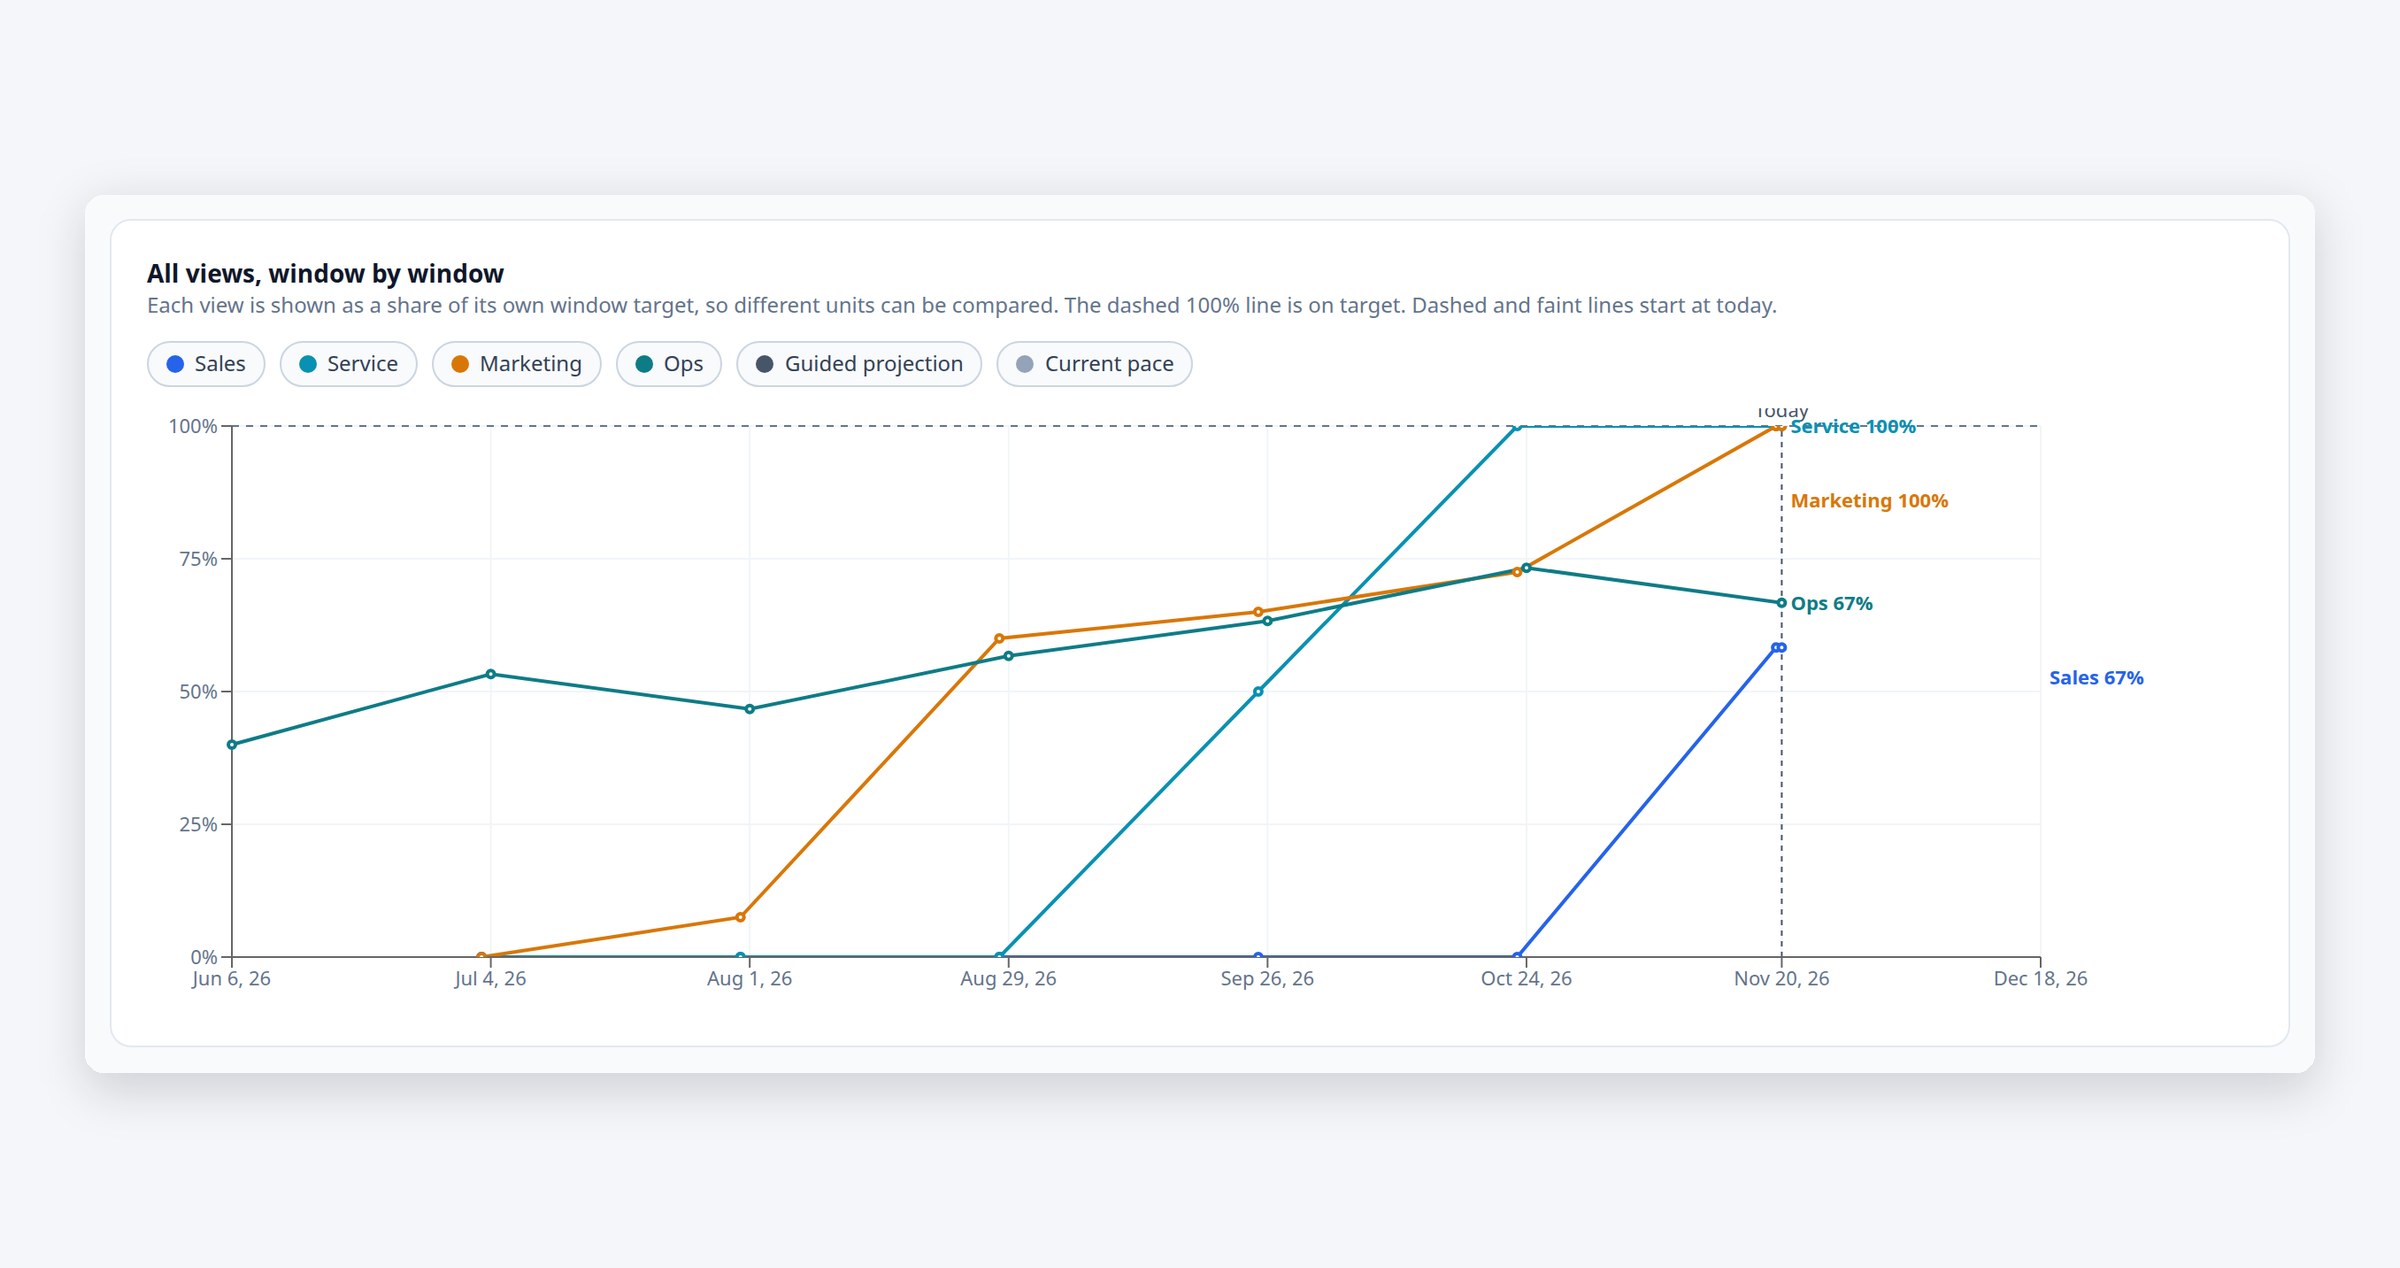
-
4
Broken out
The same picture, broken out by area. Each card shows where that team stands and what it counts.
Own targetsWindow by window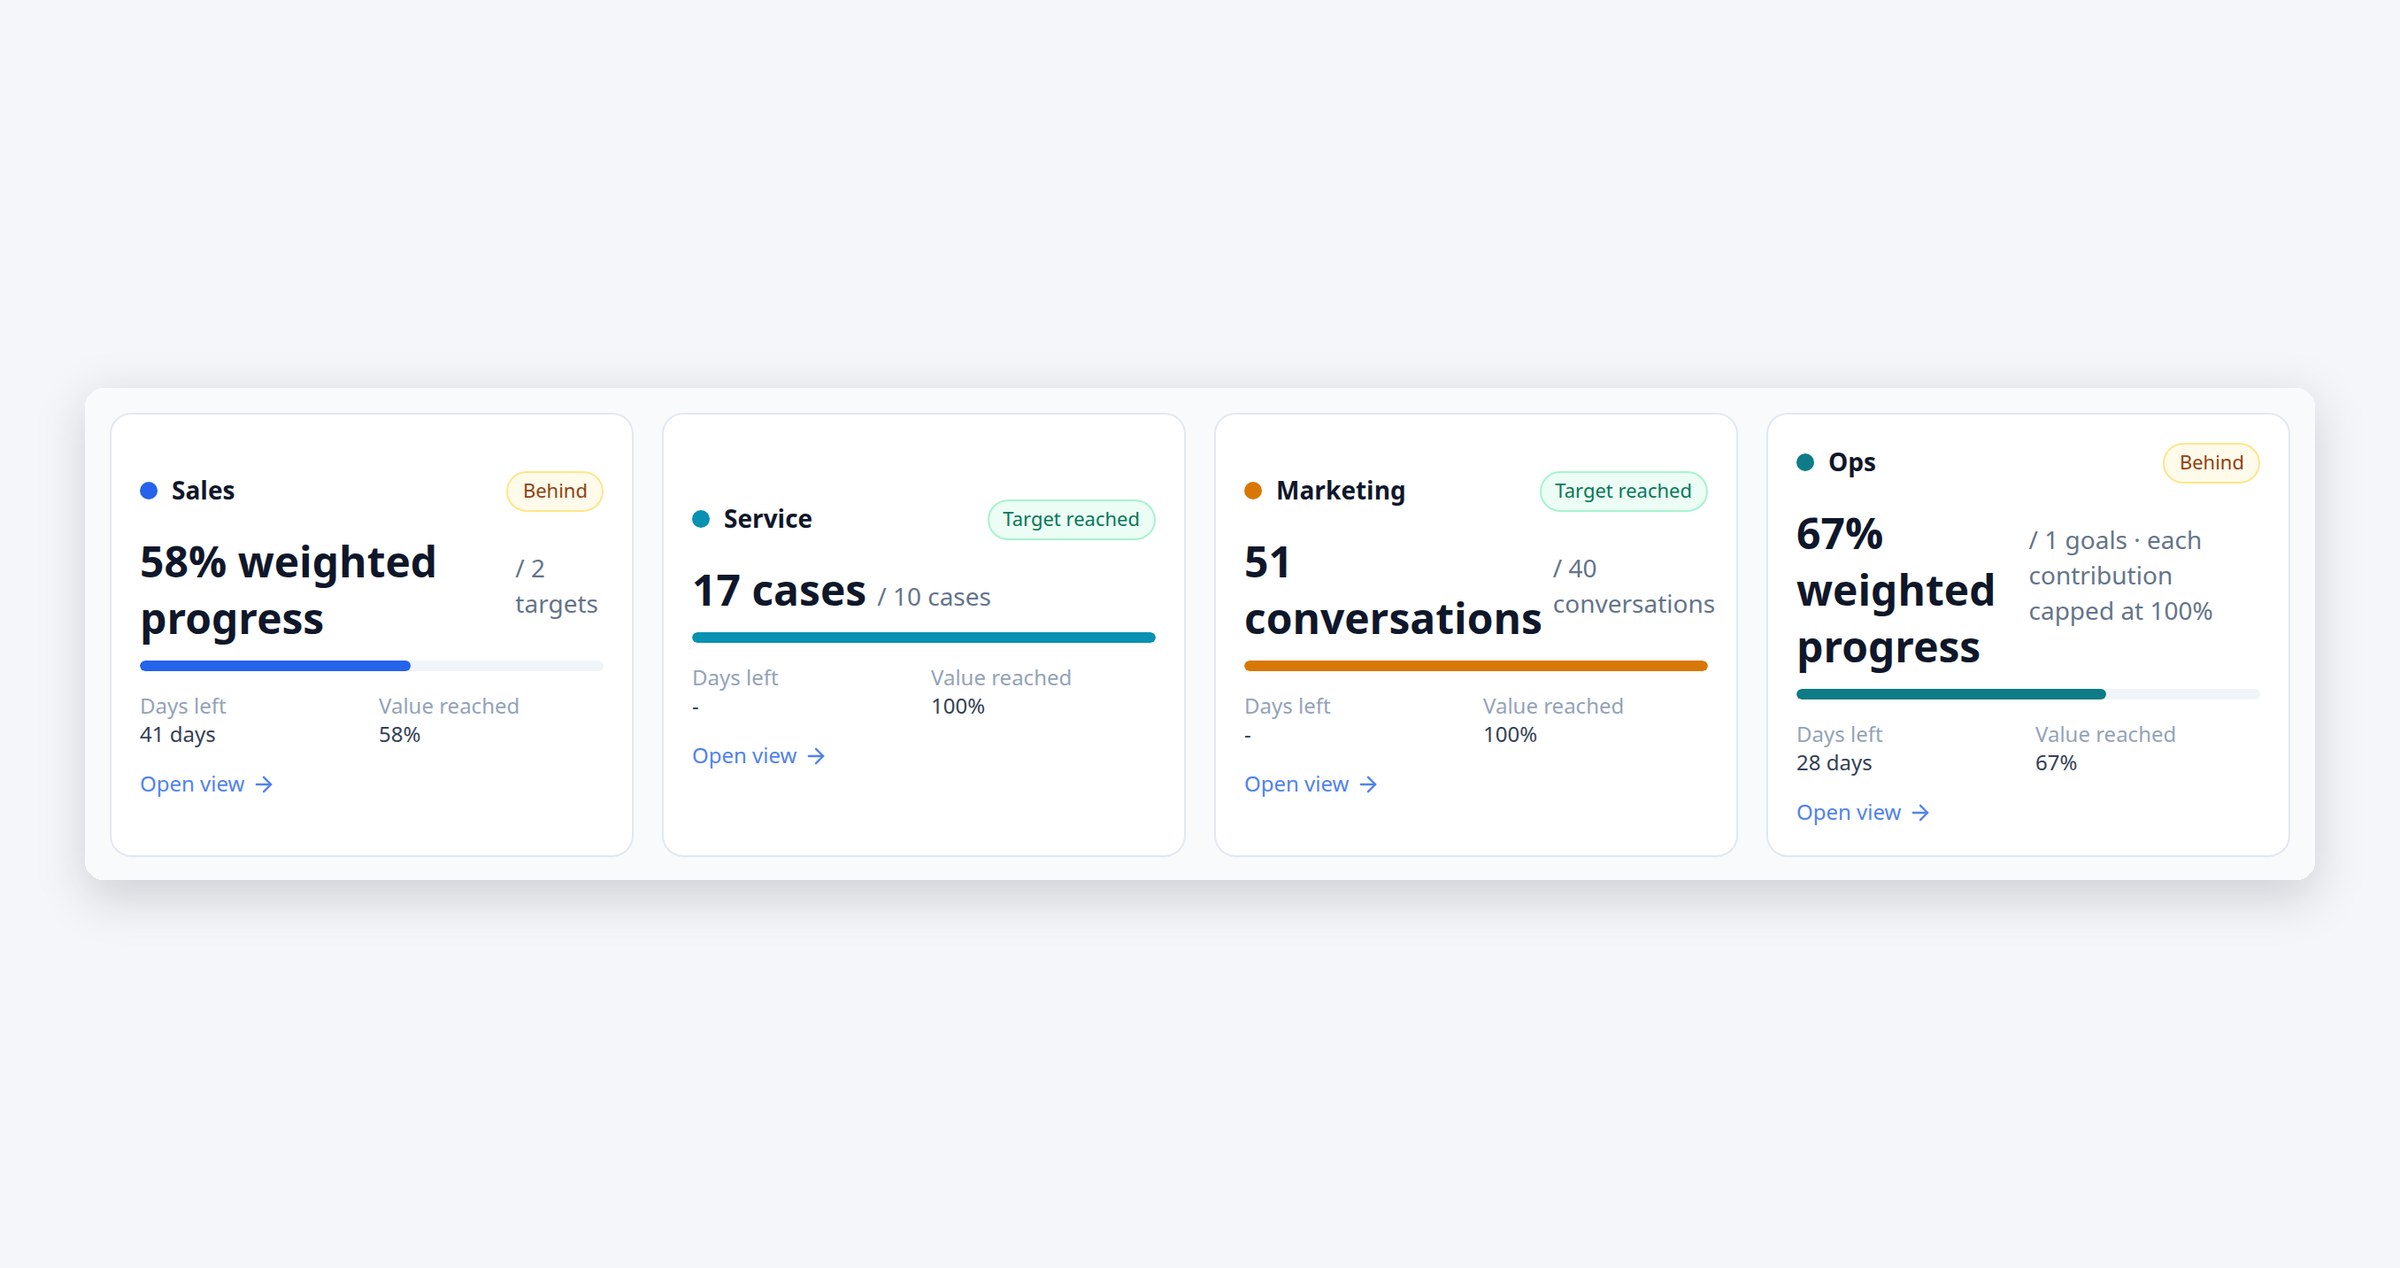
-
5
Pipeline counts on the Sales side
Sales success is Closed Won, and pipeline is factored in, because pipeline is valuable before it closes.
Closed WonPipeline coverage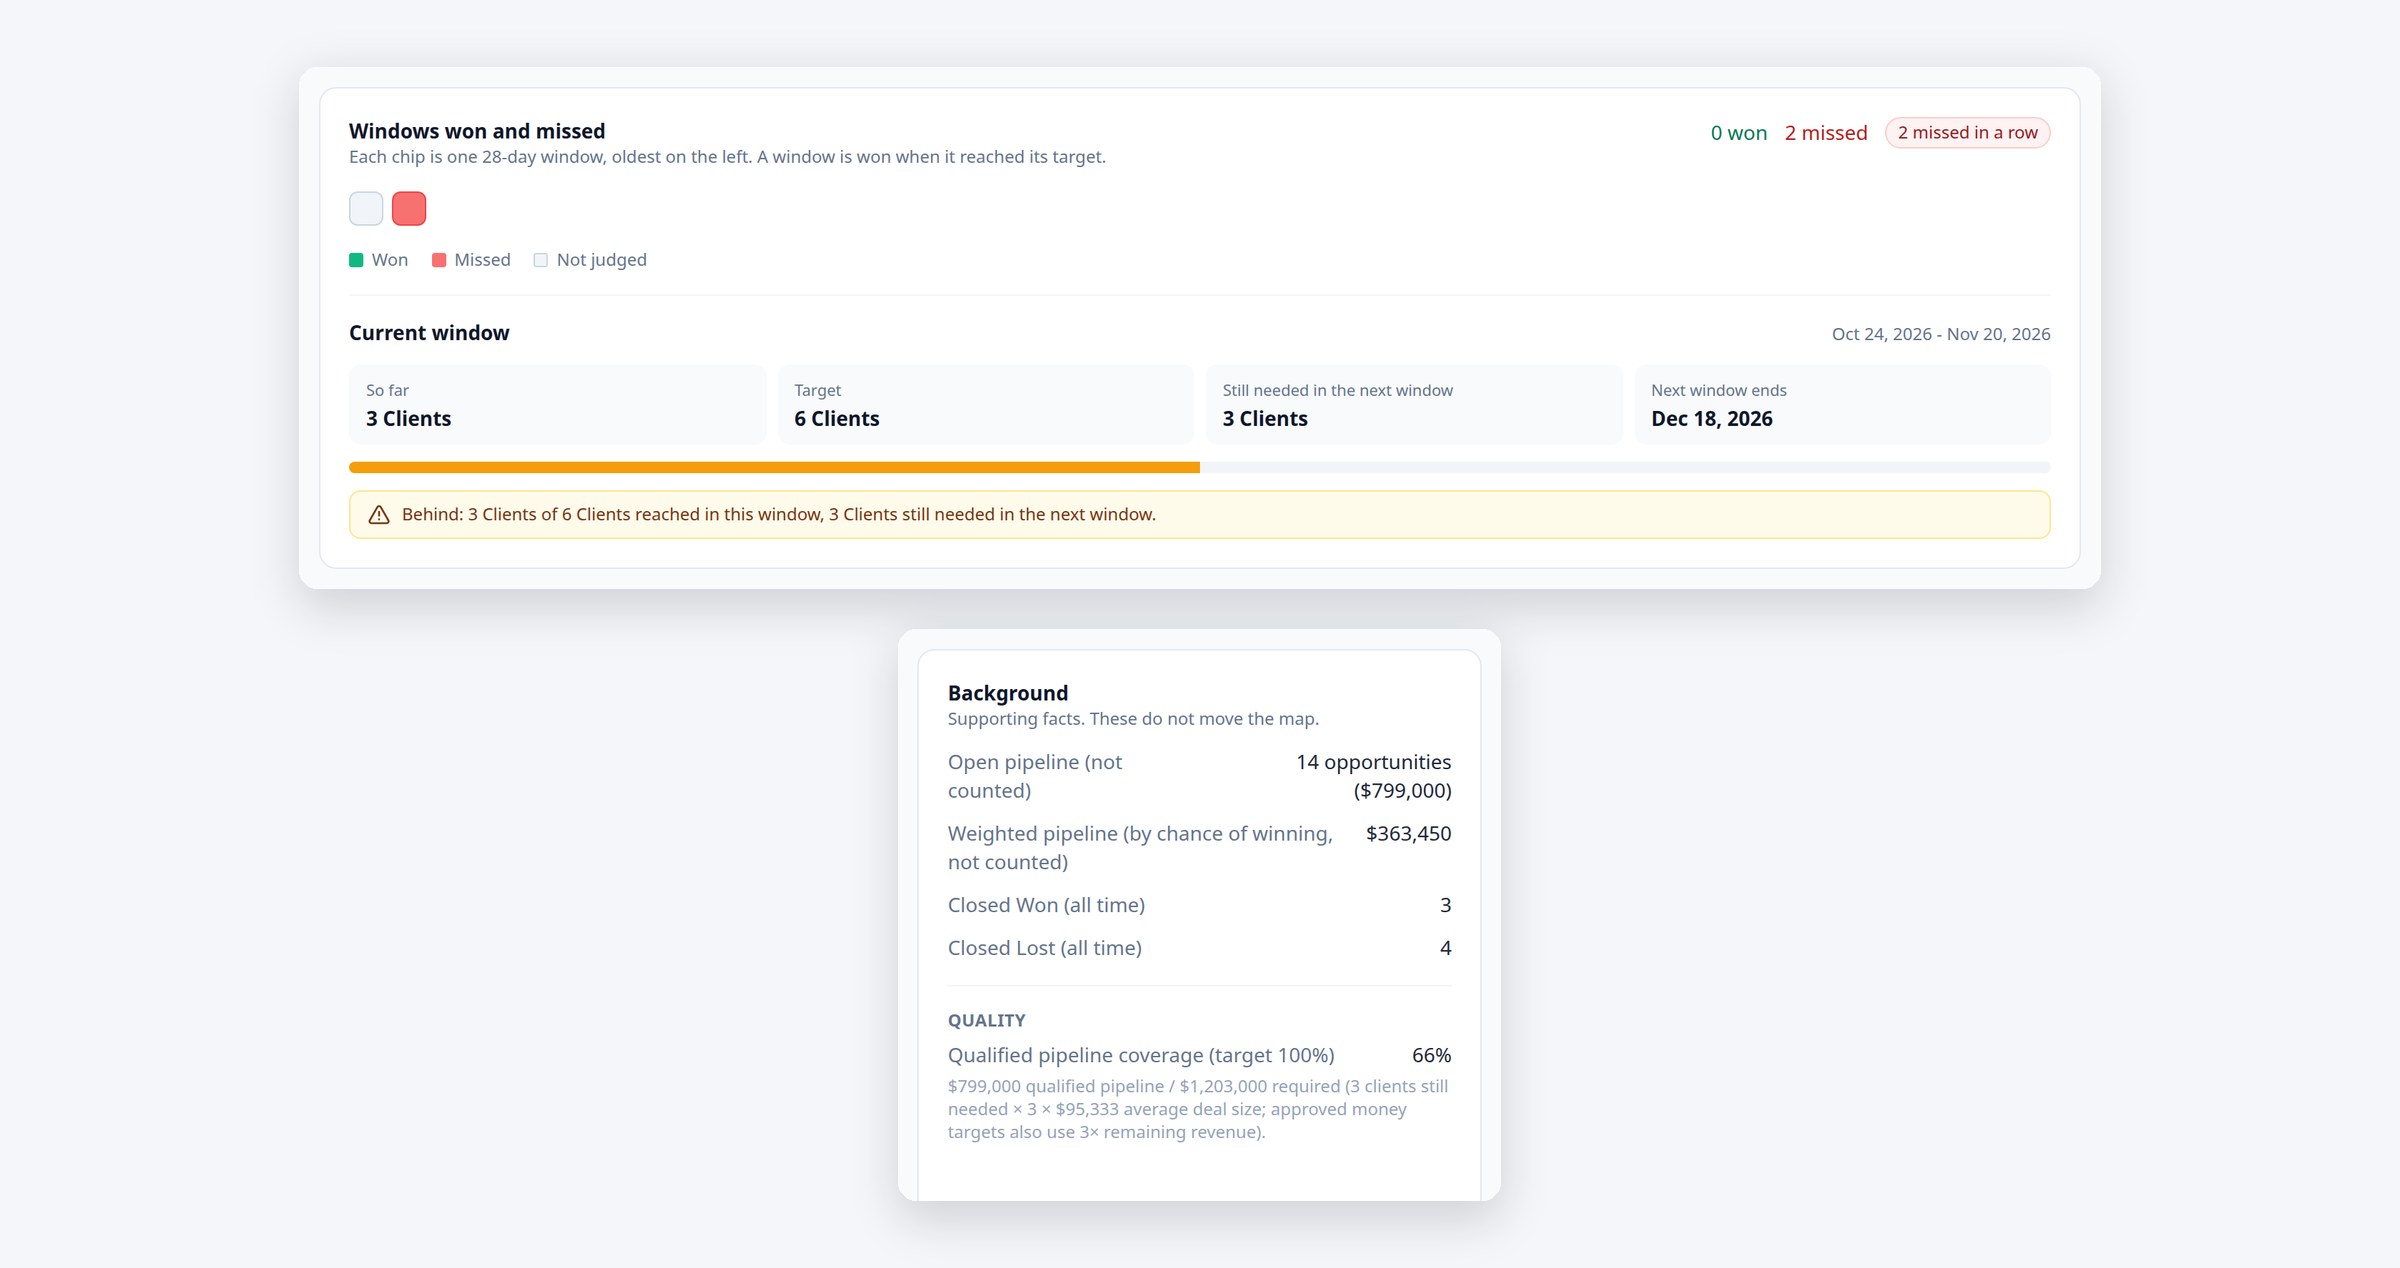
-
6
Service success is a well-rated closed case
Service counts closed client cases that clients rated highly, not tickets touched.
Closed client casesClient ratings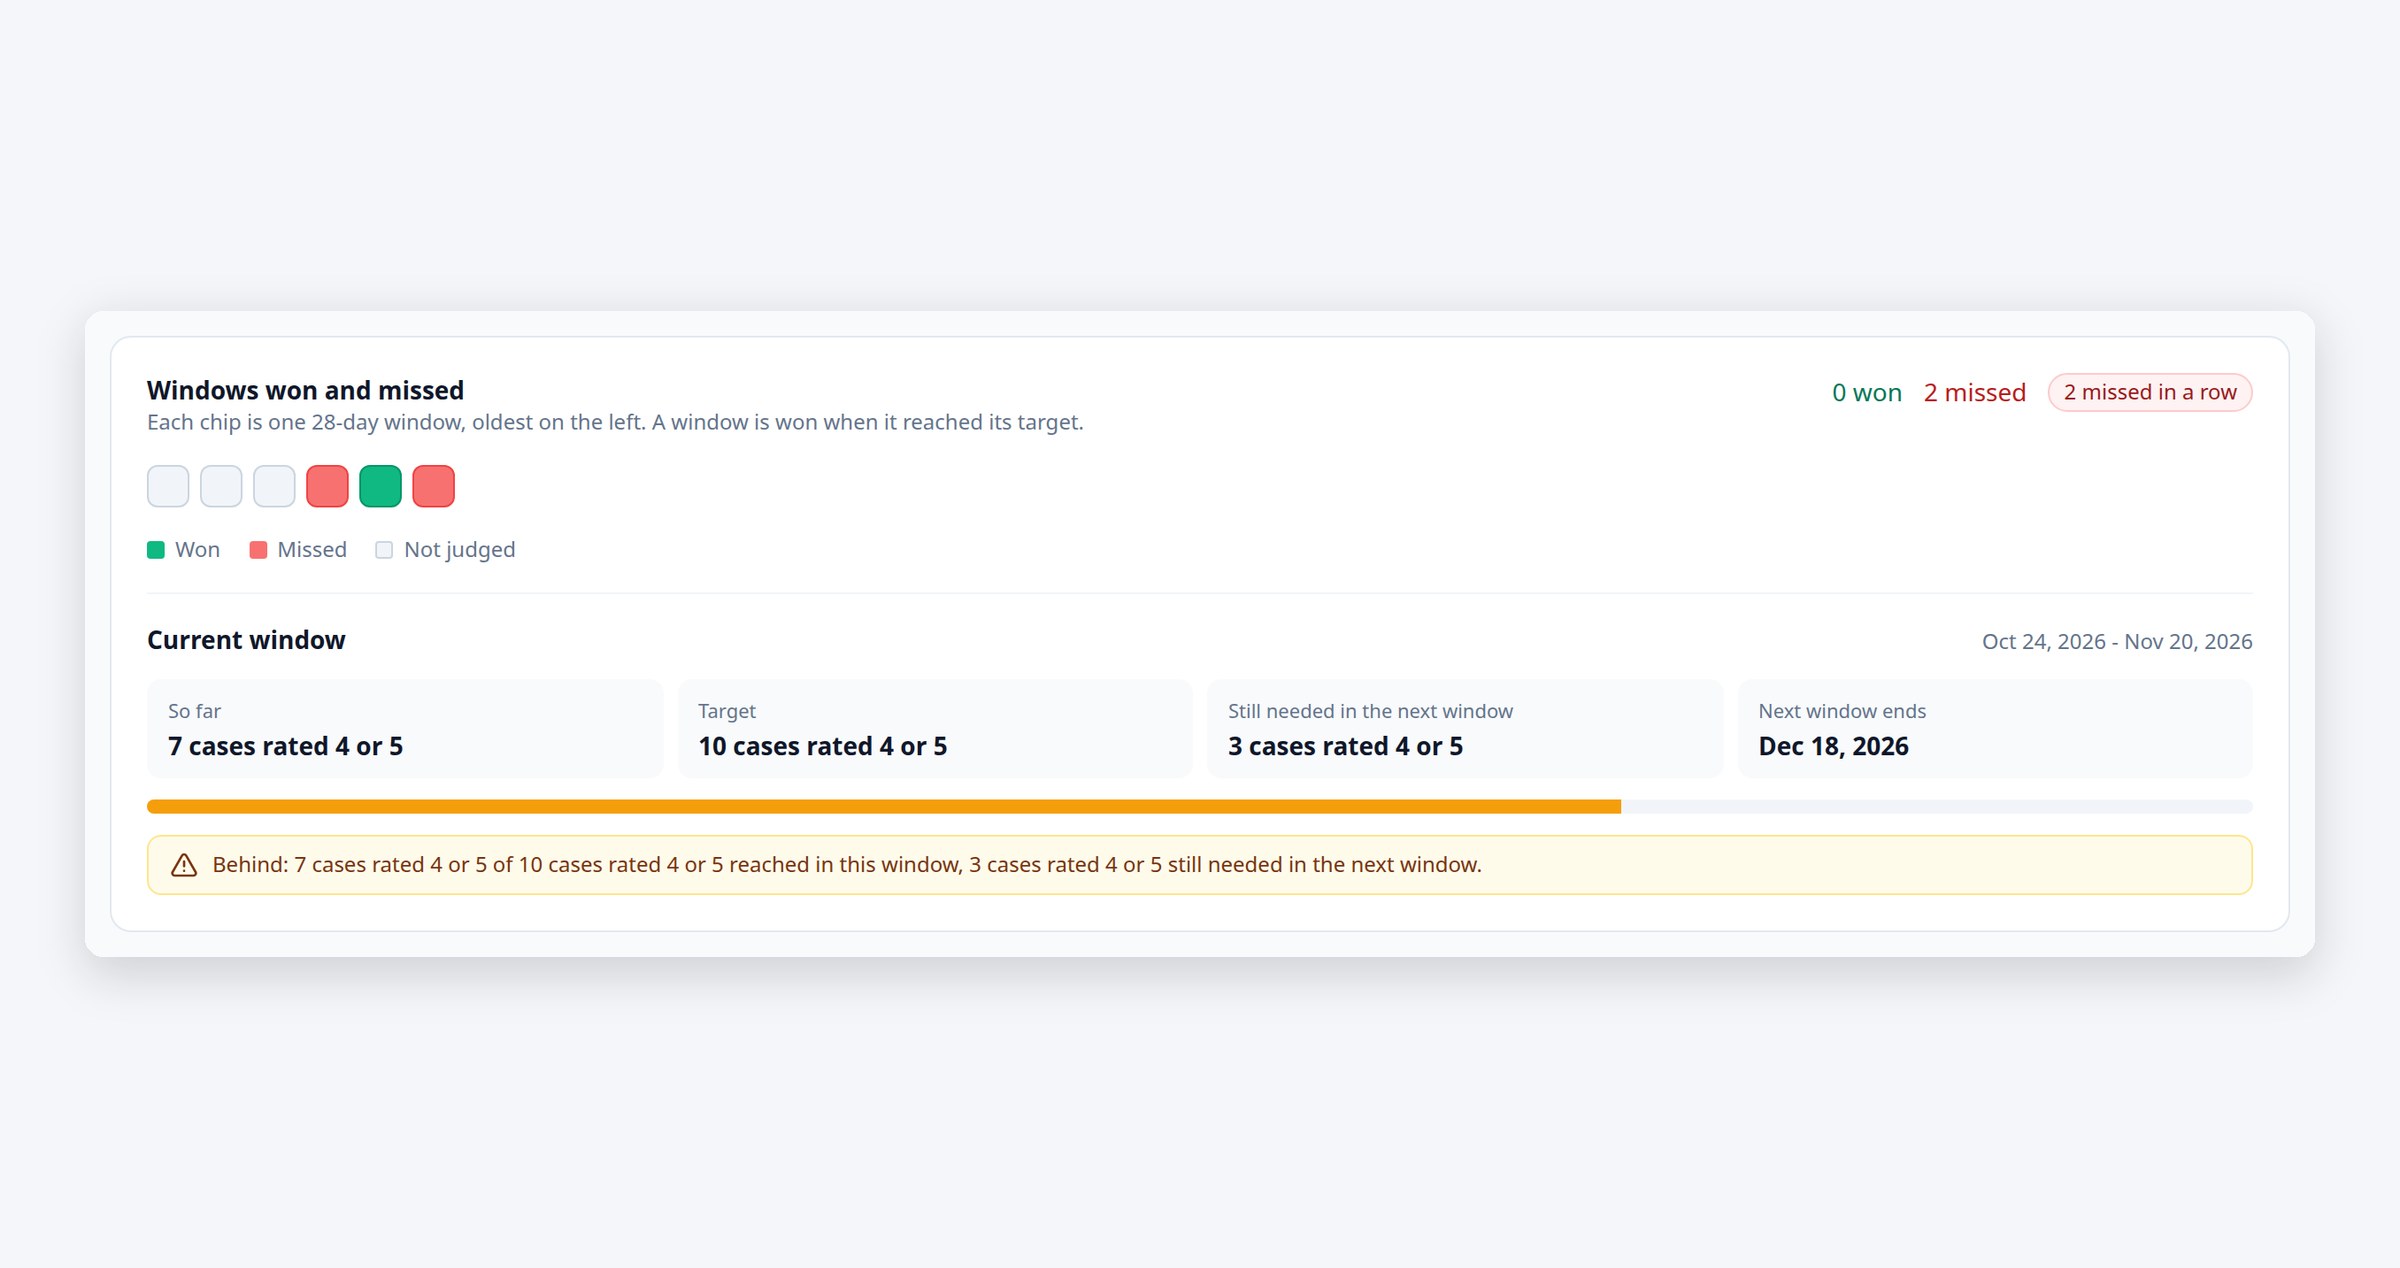
-
7
Every area on one map
The Direction map places every area by where it is and where it is heading, so the gaps between teams are visible at a glance.
Where it isWhere it's heading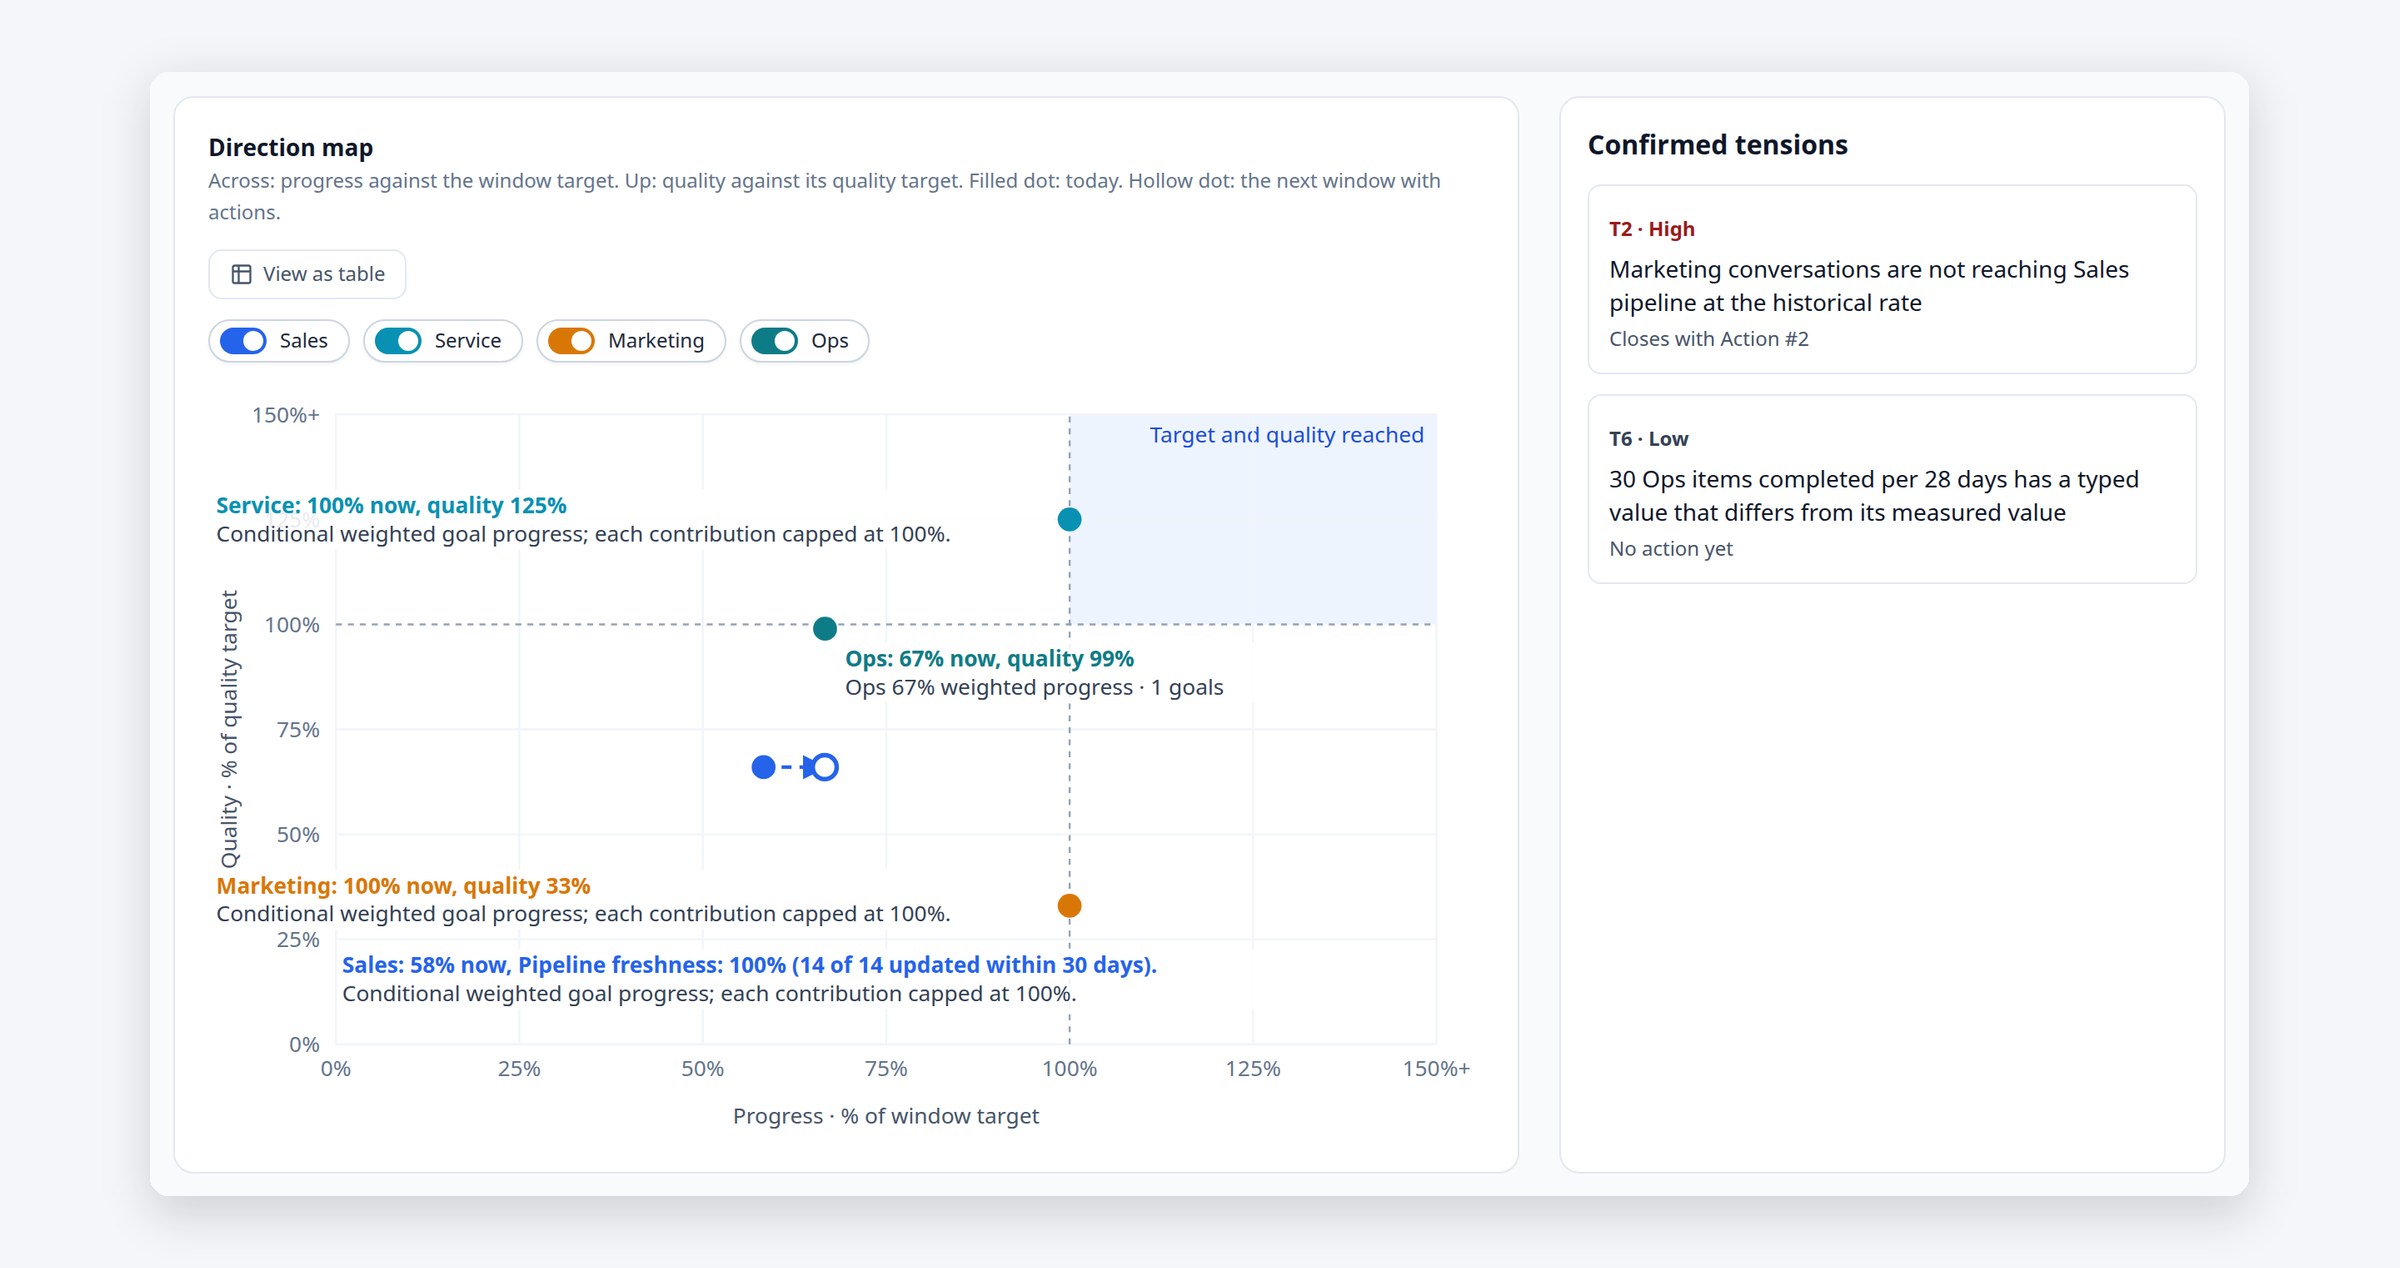
-
8
The handoff gets an owner on both sides
Tension T2: Marketing conversations are not reaching the Sales pipeline. Each side has a named owner and a suggested fix. Tensions proposed by AI wait for human review before they count.
Owners on both sidesAI proposals reviewed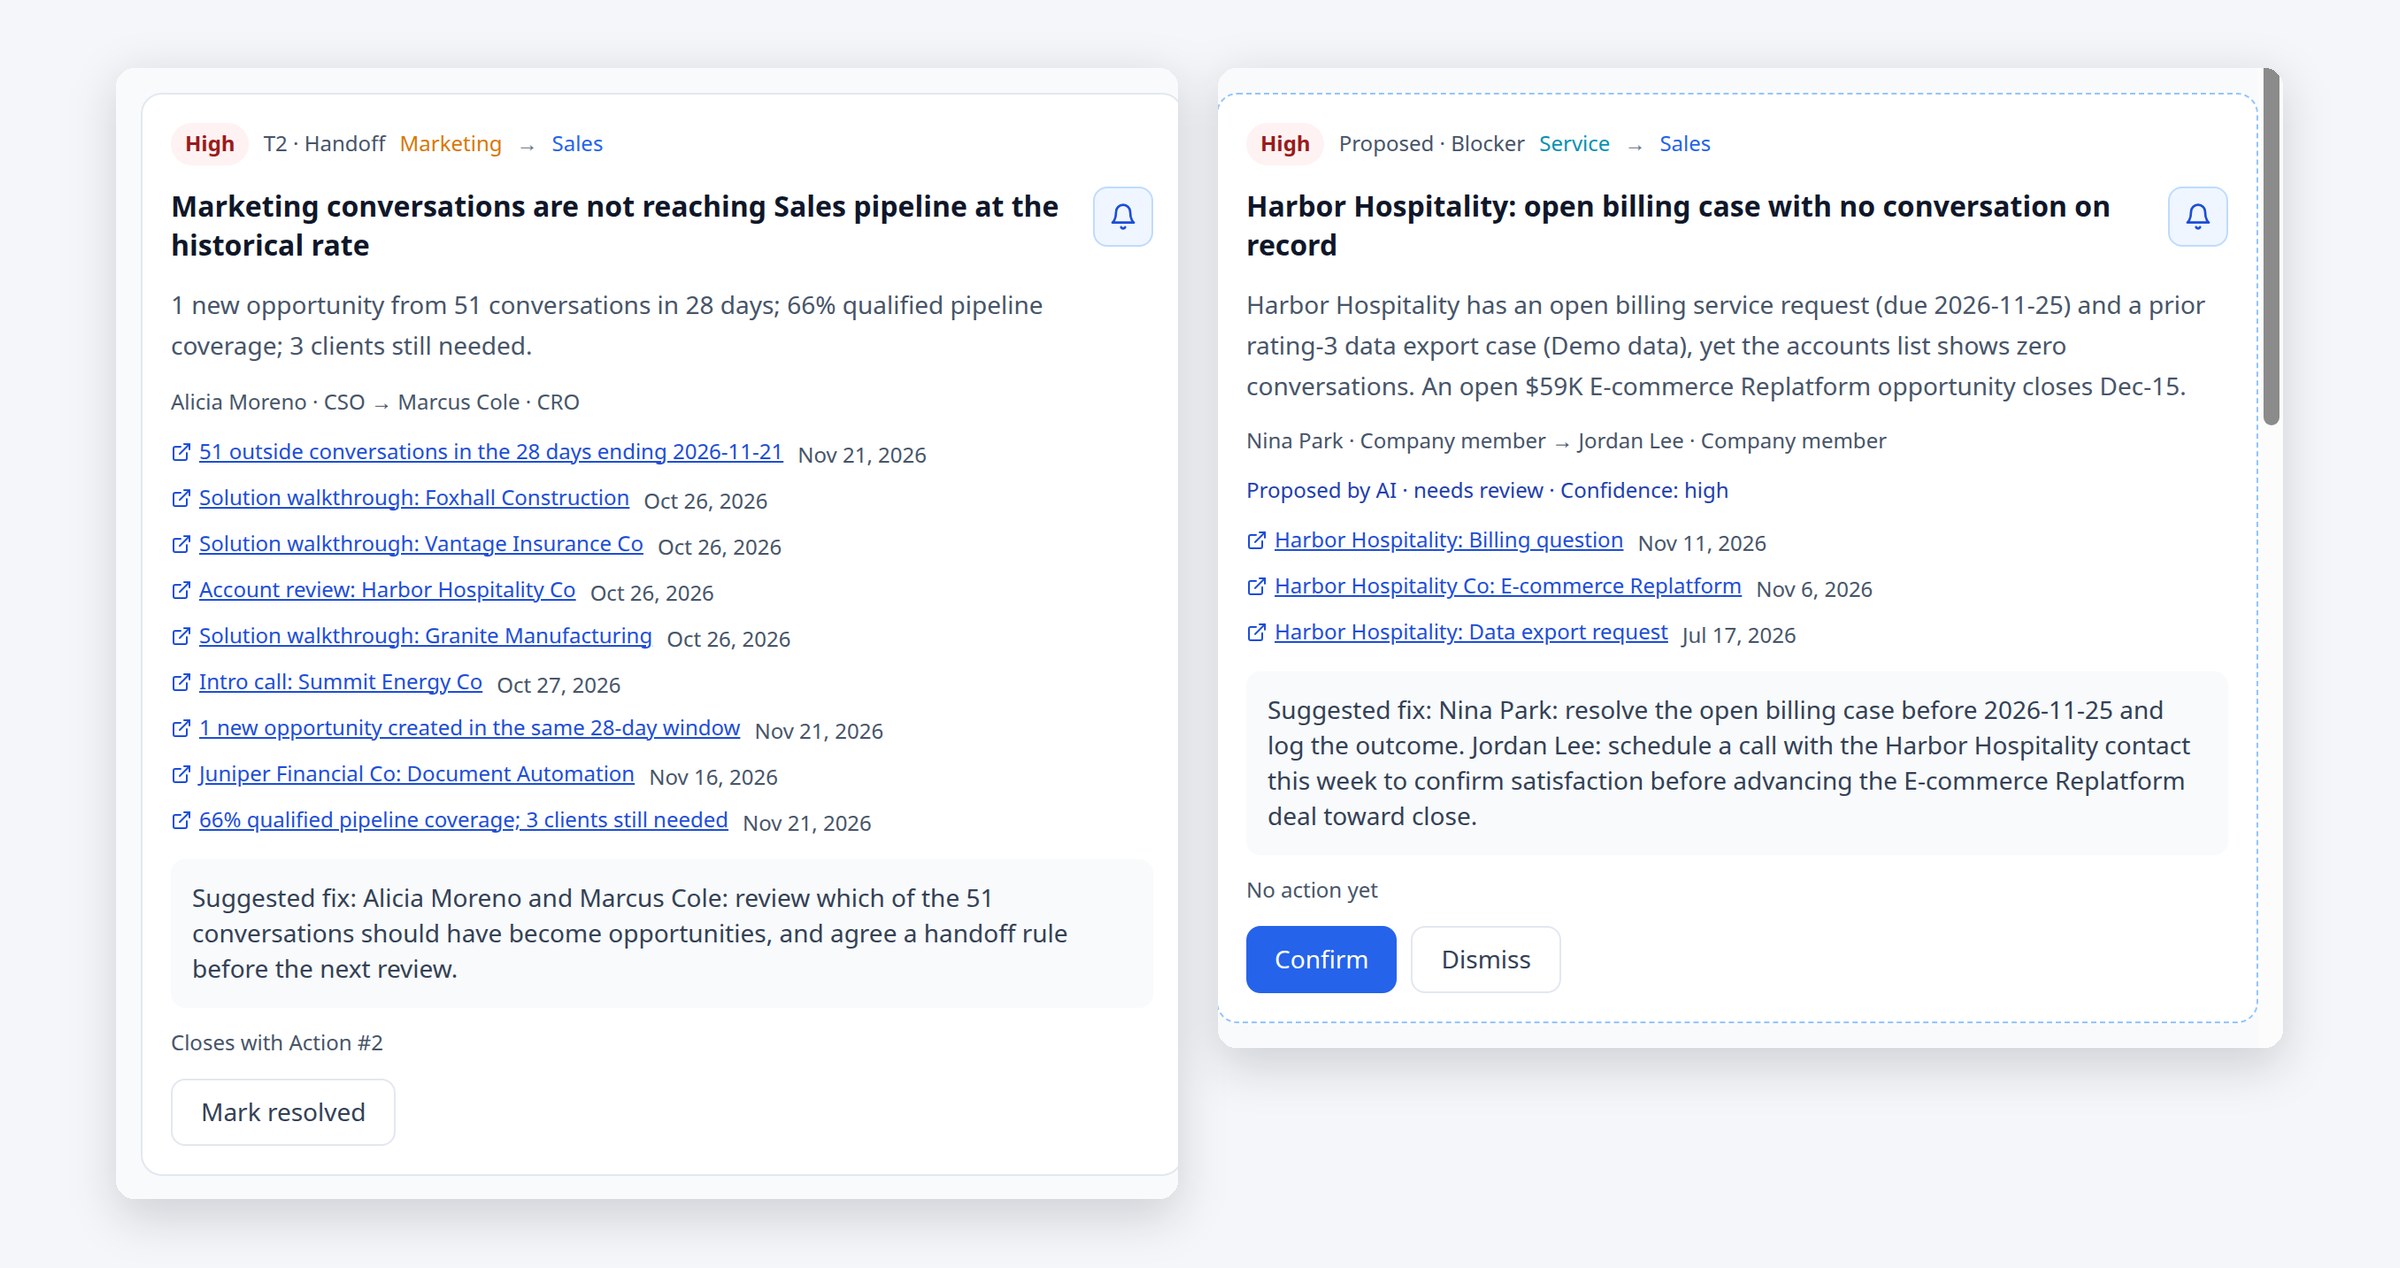
-
9
Ranked by the gap each action closes
One action plan for the whole company, ranked by how much of the gap each action closes. Action #2 closes tension T2.
Ranked by gapCloses T2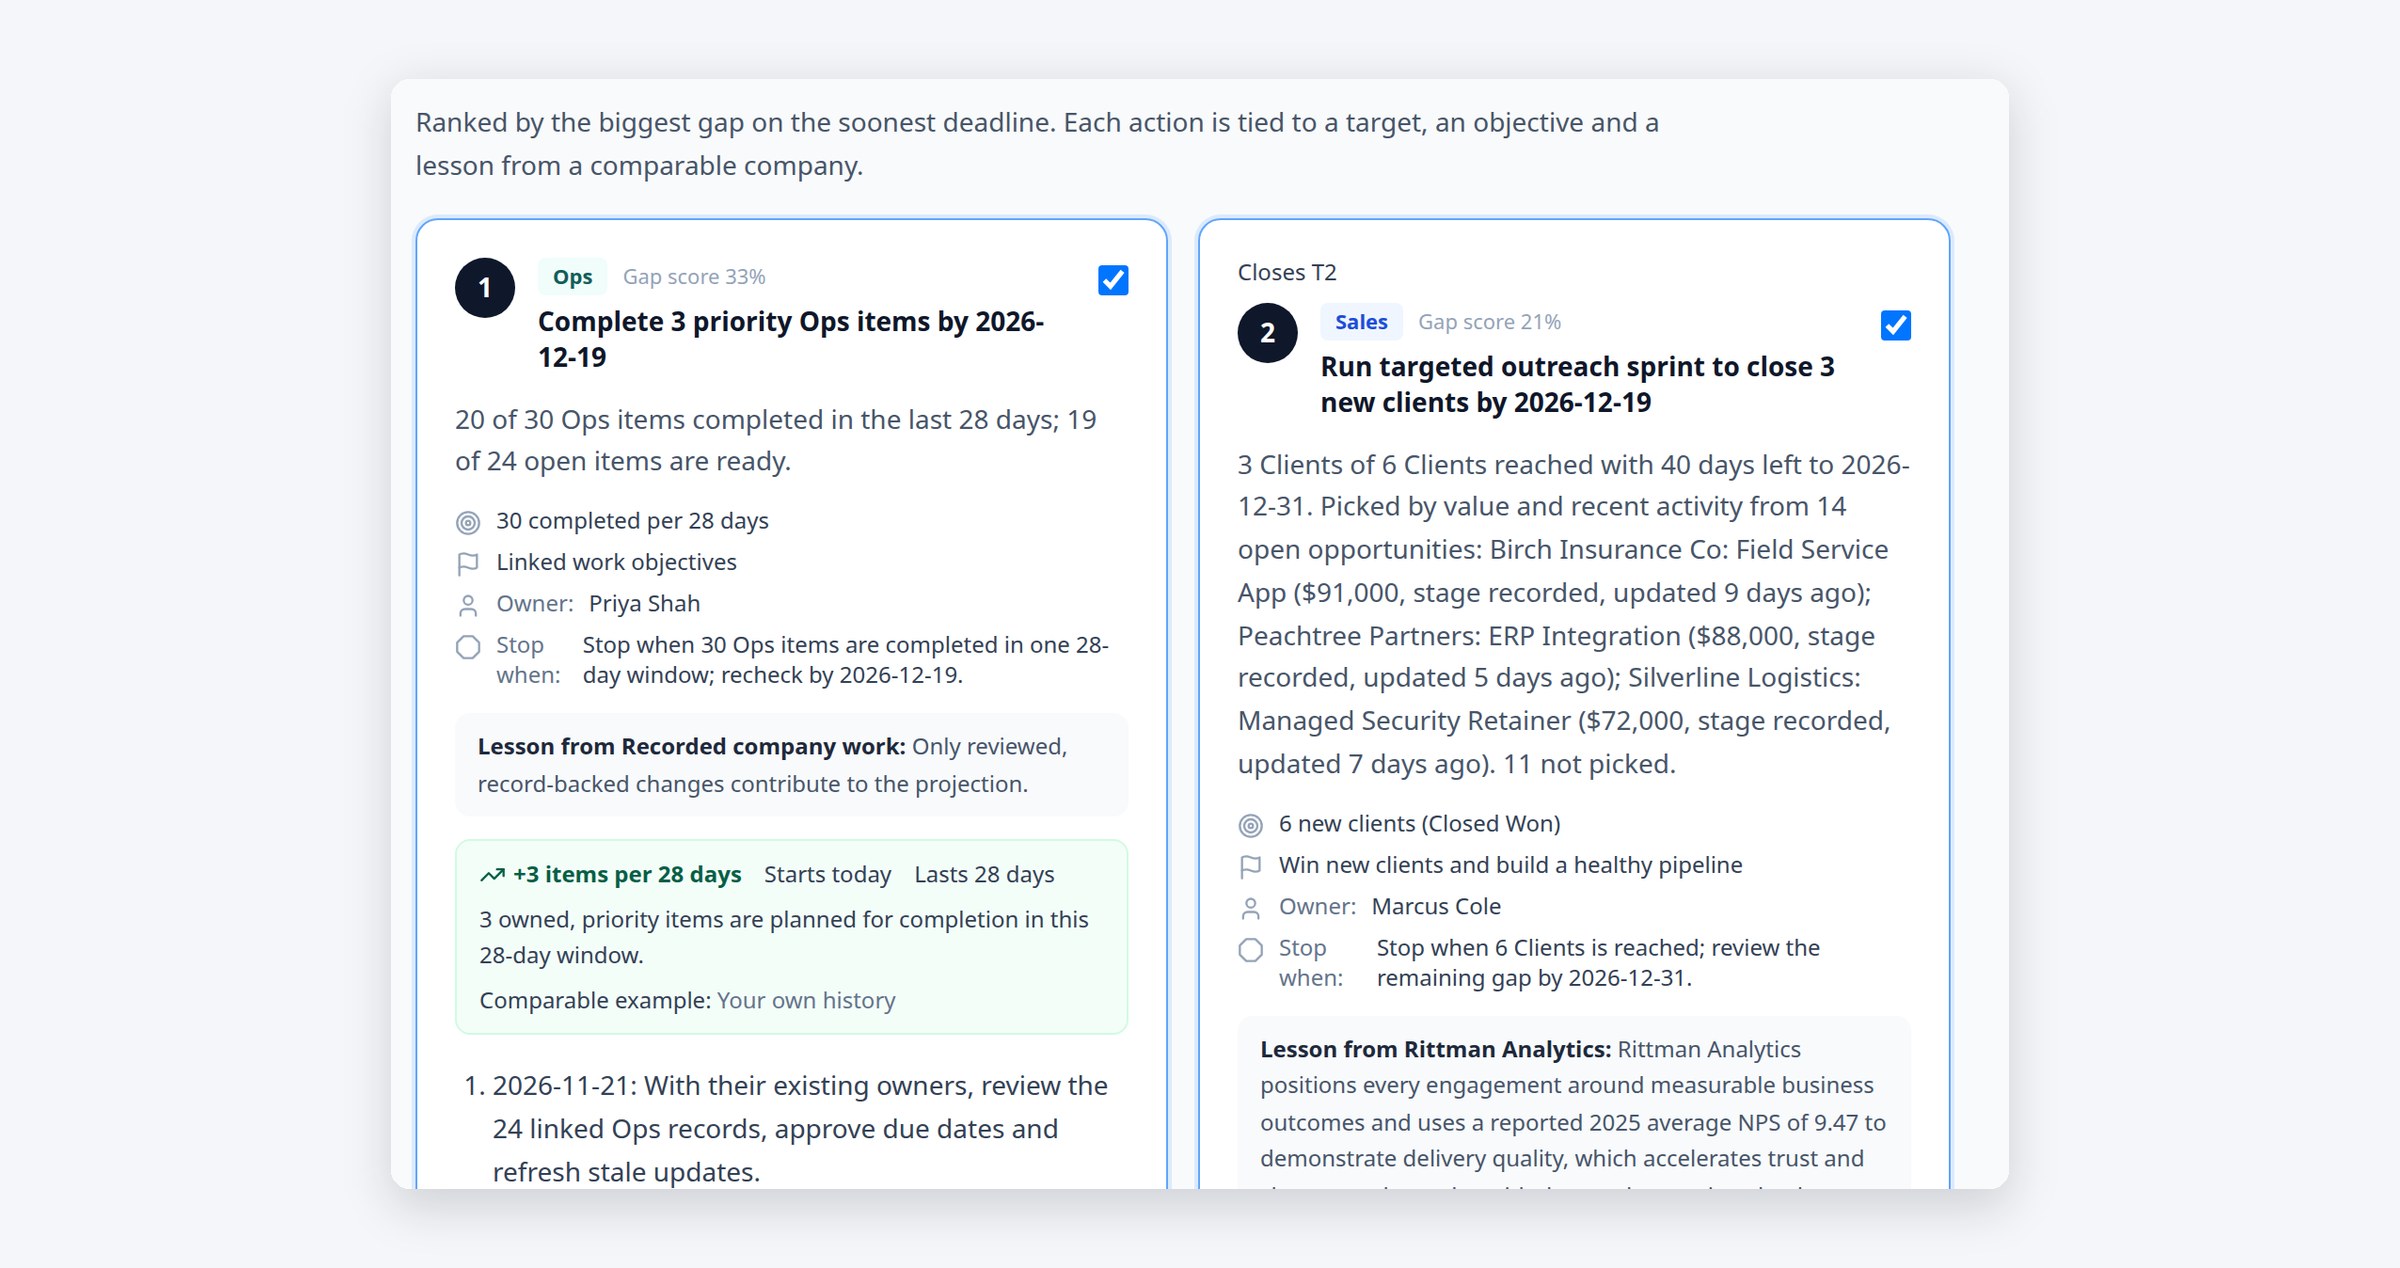
-
10
Targets set against real peer growth
Growth targets start from the middle yearly growth of real peers with public figures, plus extra points the company chooses. Company Admin confirms them.
Public figuresCompany Admin confirms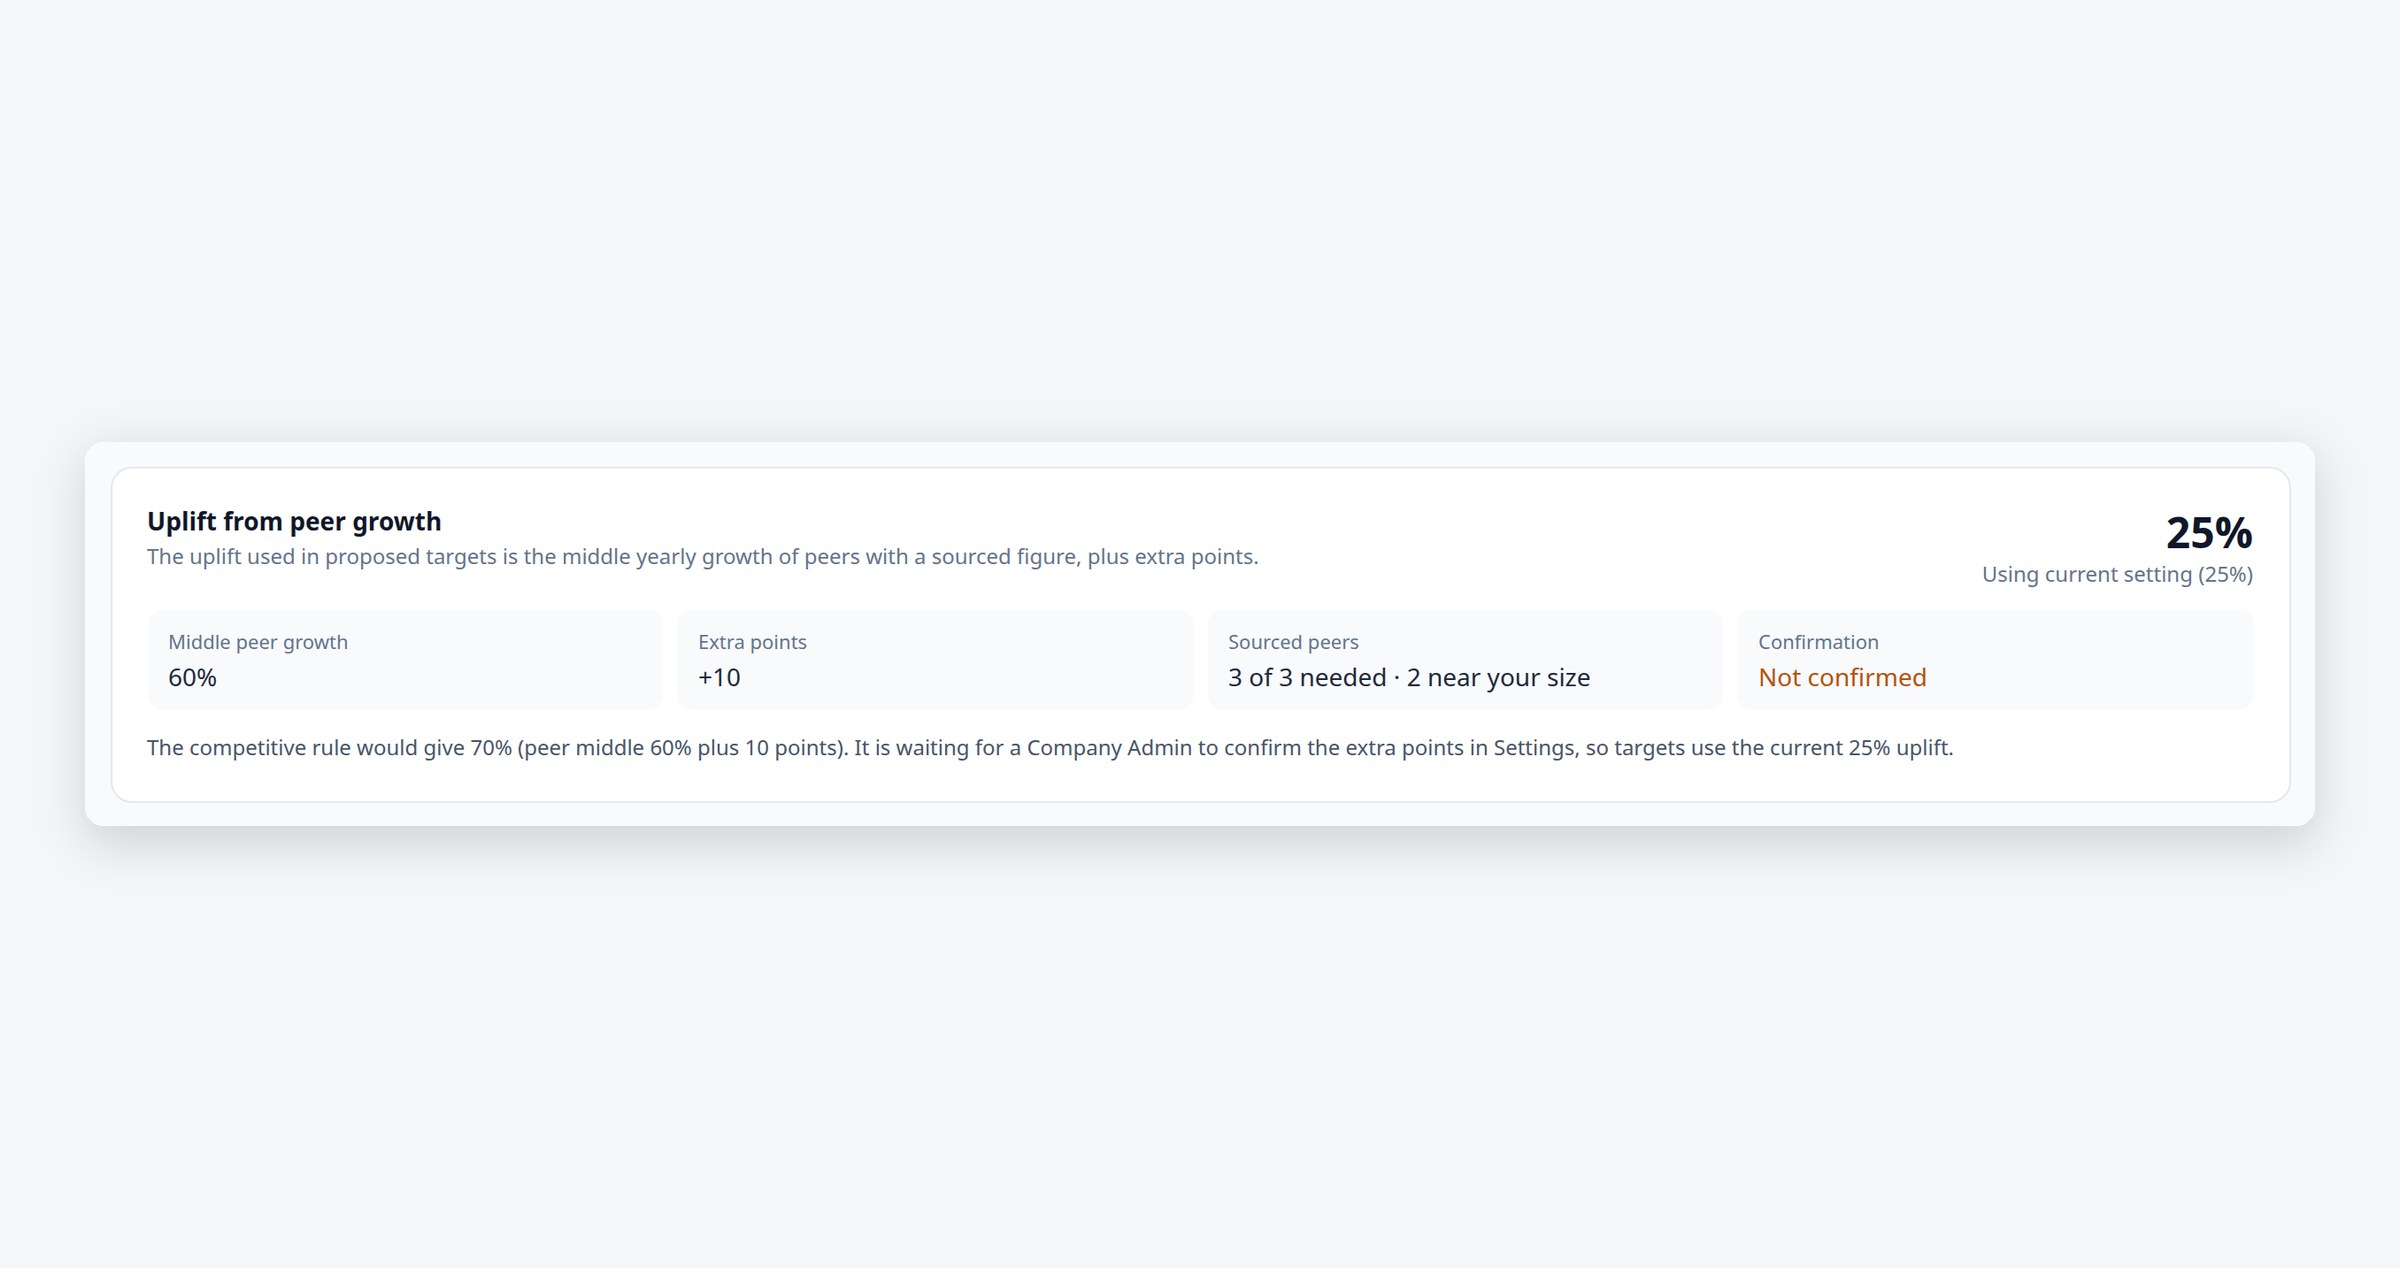
-
11
Lessons from companies like yours
Comparable companies with sourced growth, such as Rittman Analytics at 60%, and the lesson from each feeds straight into Action #2.
Sourced growthLessons into actions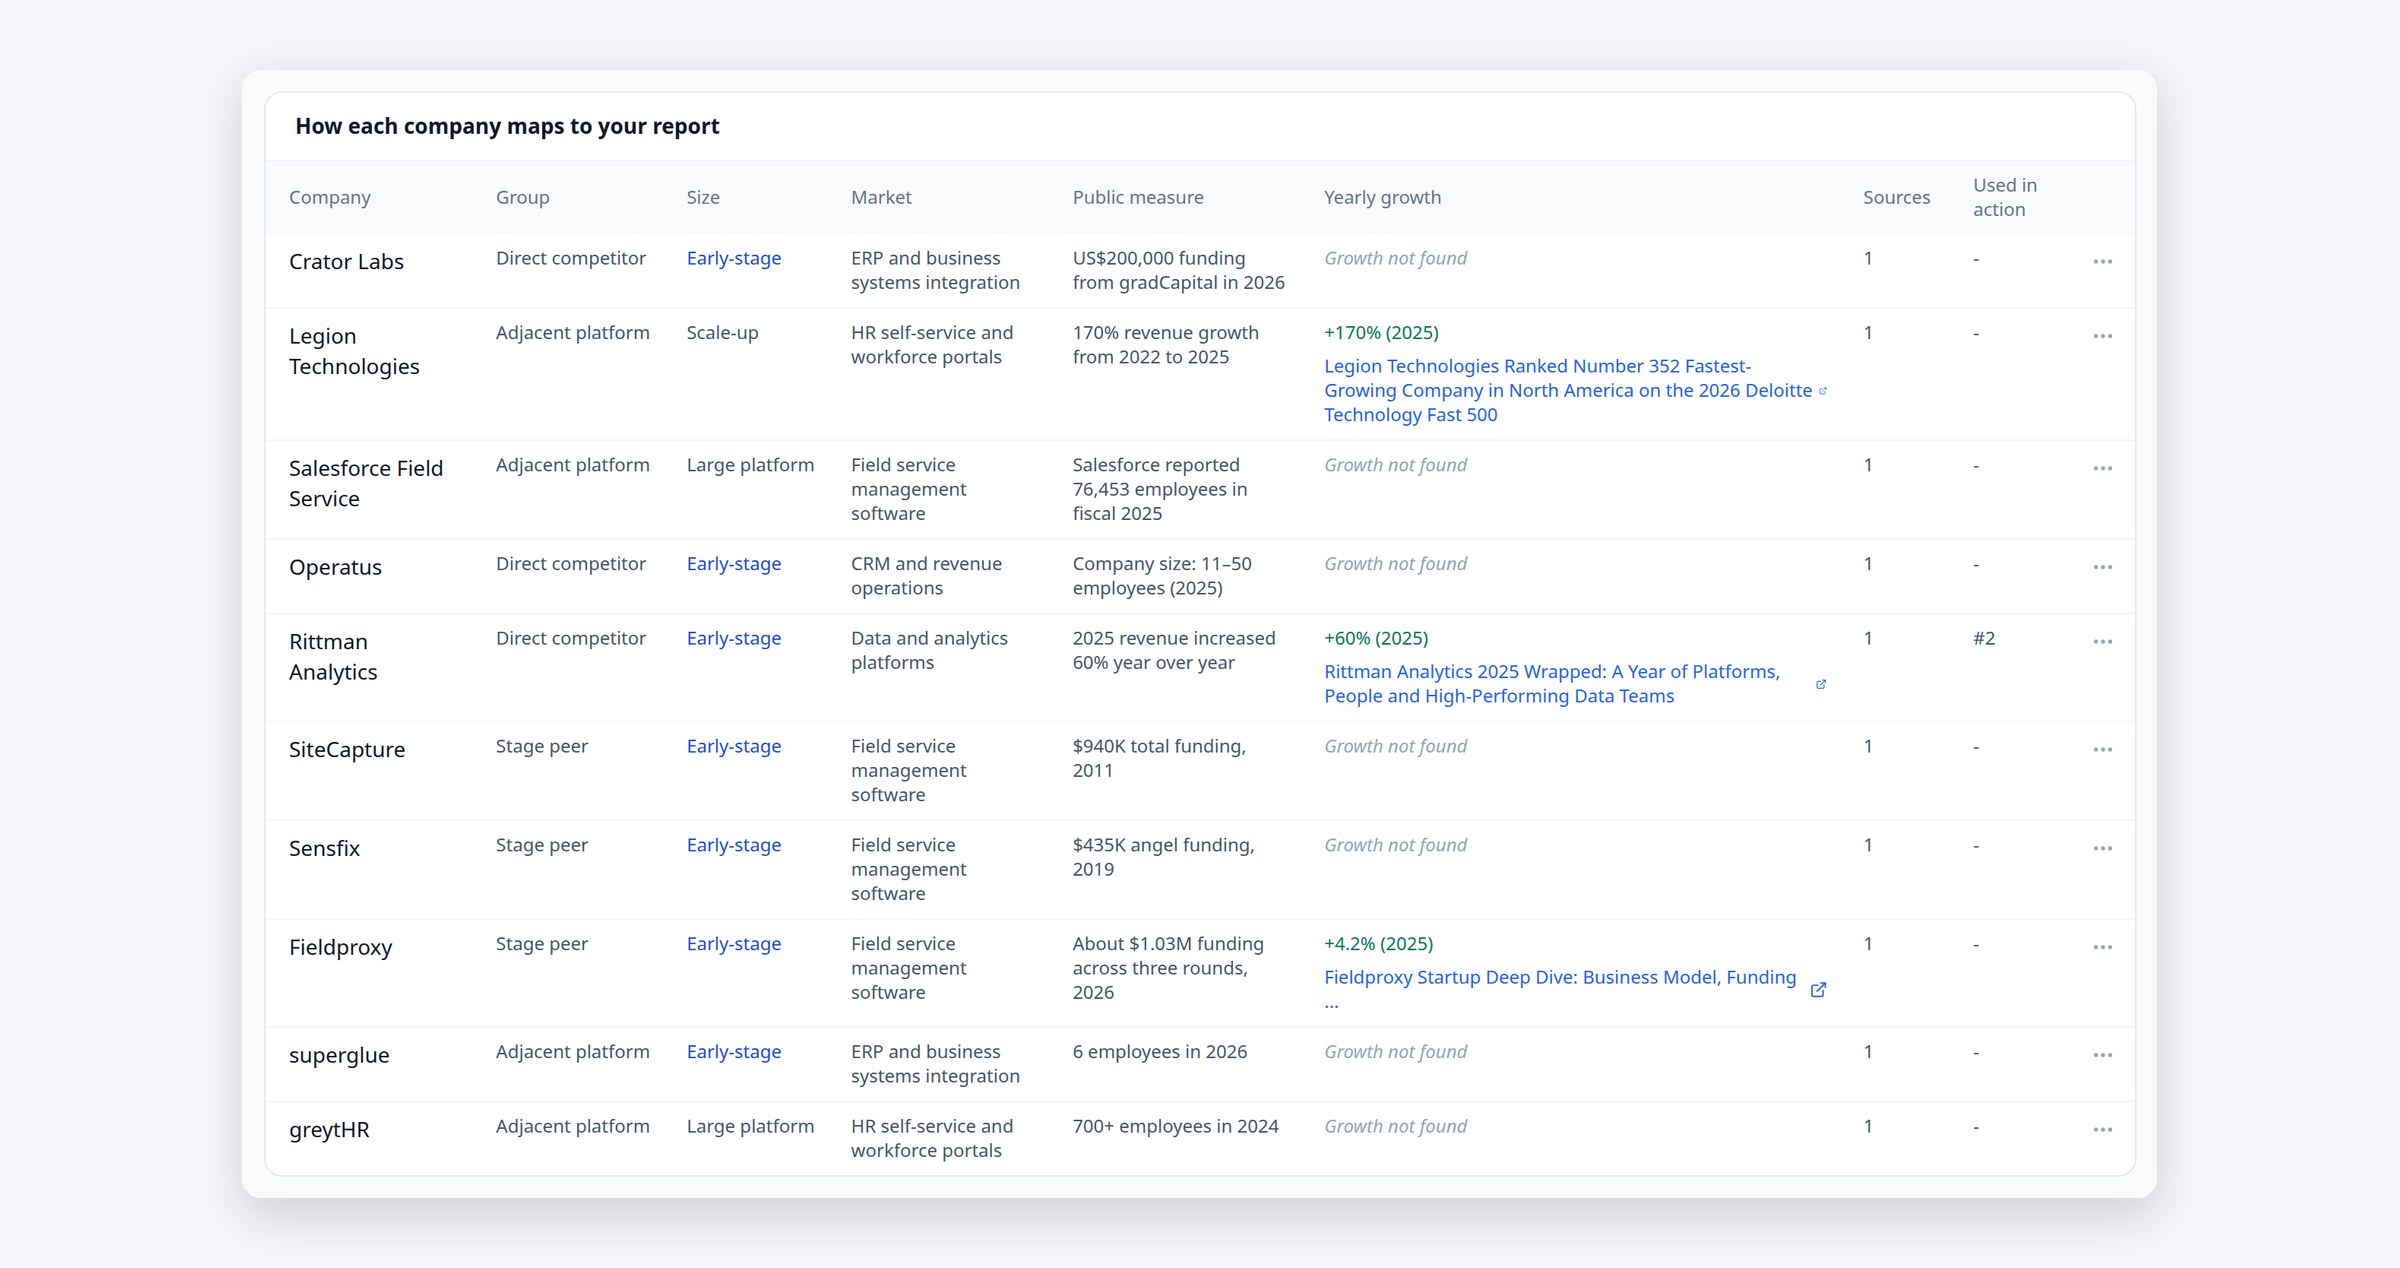
Every team can look fine. Alone.
Marketing hits its conversation target while Sales is behind on new clients, and each dashboard tells its own story. Direction reads them together, so the stalled handoff shows up as one shared tension with an owner on each side and one action to close it.
One picture of growth.
Sales, Marketing, Service and Ops on one chart, each against its own target, then broken out by area. Sales counts Closed Won and pipeline. Service counts well-rated closed client cases.
Named owners, both sides.
When one team’s results stop reaching the next, Direction names the tension, links the evidence and sets an owner on both sides. Every tension gets an action.
Measured against peers.
Targets start from the middle yearly growth of real peers with sourced public figures, and lessons from comparable companies feed straight into the actions.
Silos. One plan.
Welcome to the Oasis.
Want Direction on your own numbers? See it running on your own Sales, Marketing, Service and Ops data. A founder replies within one business day.